Dashboards
QASS Dashboards
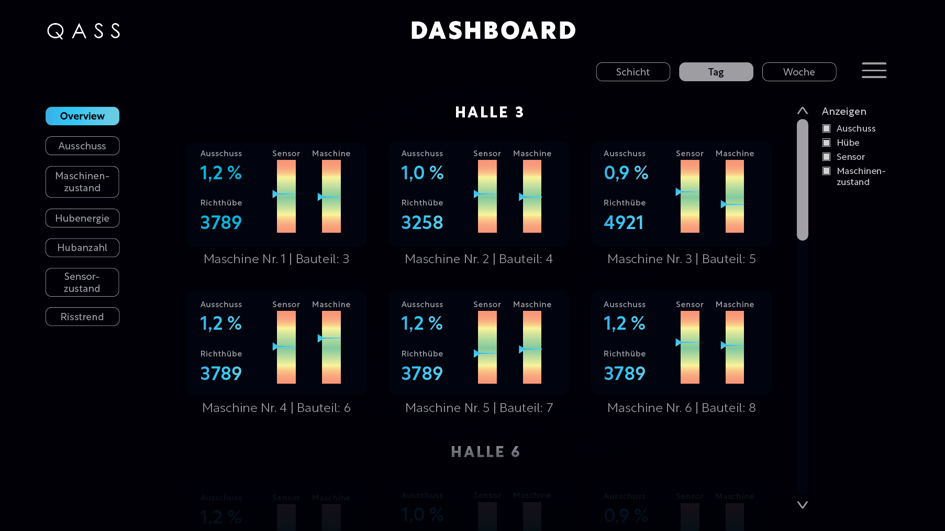
Advantages:
- Overview of all measuring systems
- Reach your measurement systems from the office via web browser
- All important information about the production at a glance
- Enables better support and faster maintenance of the system
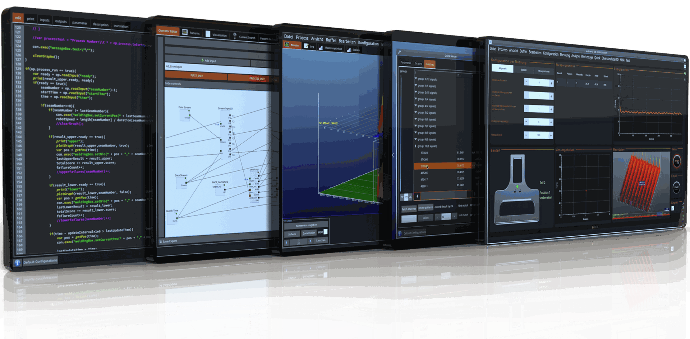
Individual user interfaces
QASS Pen-GUI
User interface completely customized to your needs
- Various options for data visualization such as shift counter, traffic light, tachometer, etc.
- Focus on the essentials - What data? How? Where? When?
- Multiple access levels
Clustering
Pattern clustering in the Optimizer4D
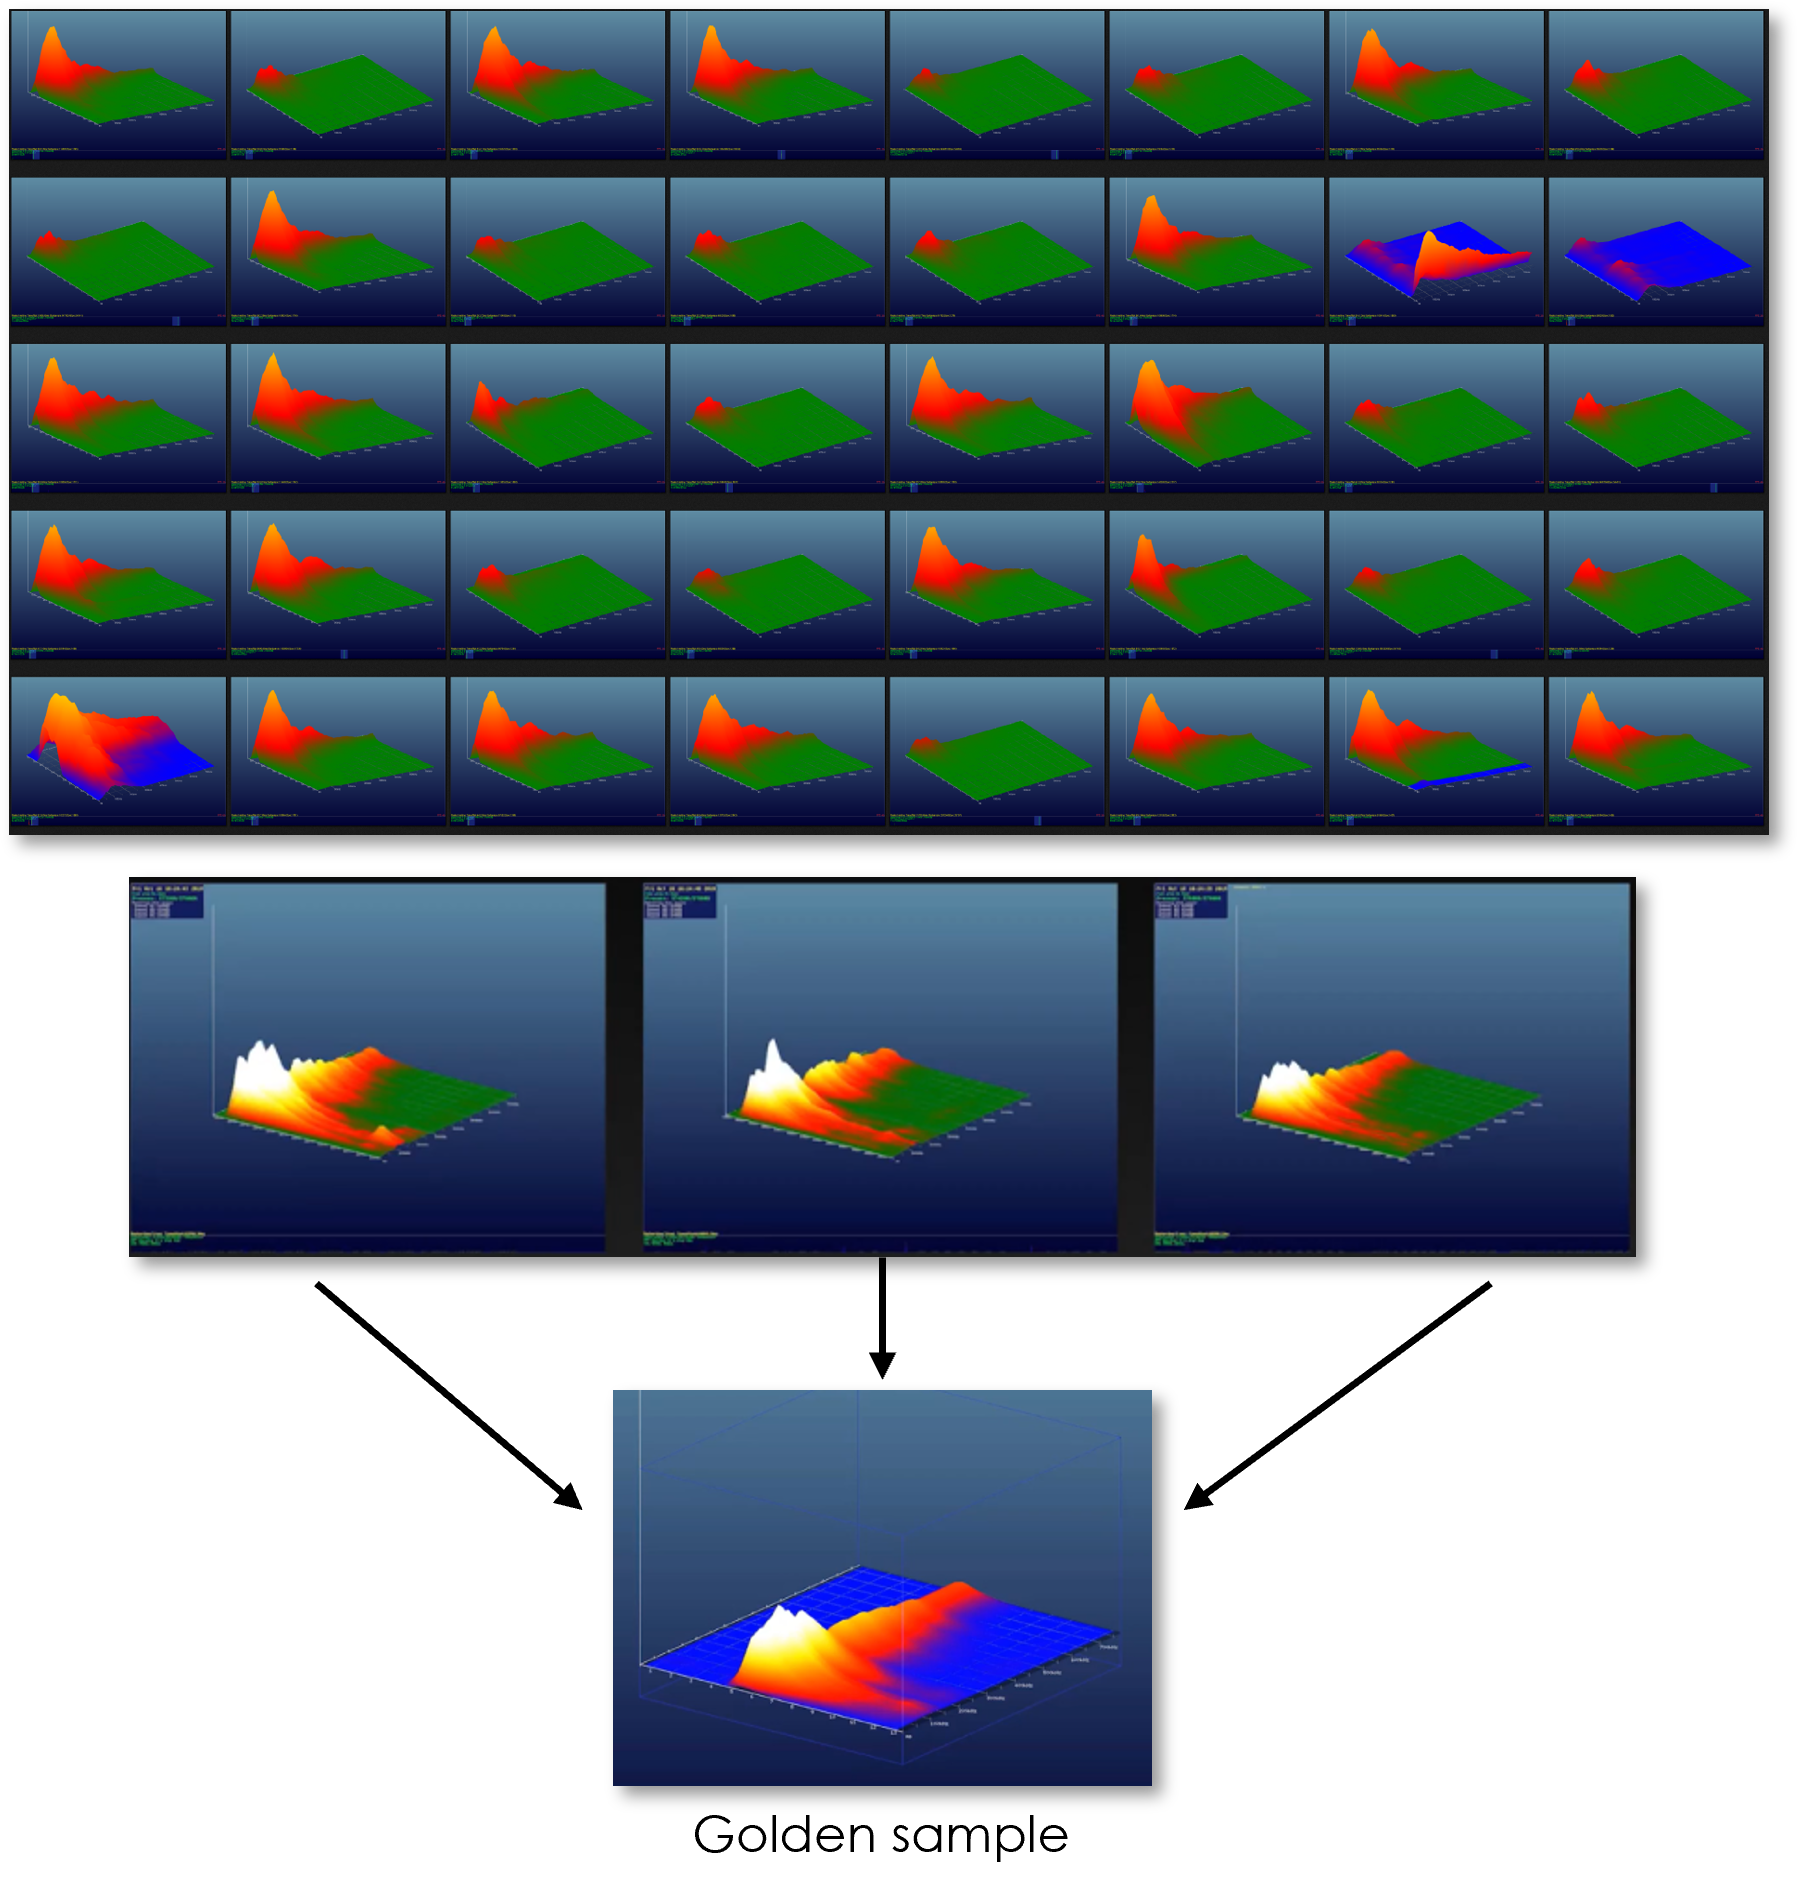
Features:
- Detected patterns are automatically clustered and grouped based on their similarity
- The different clusters are divided into "cracks", "noise" and other signal groups
- Clusters of the same signal type are calculated with each other and result in a base pattern (golden sample)
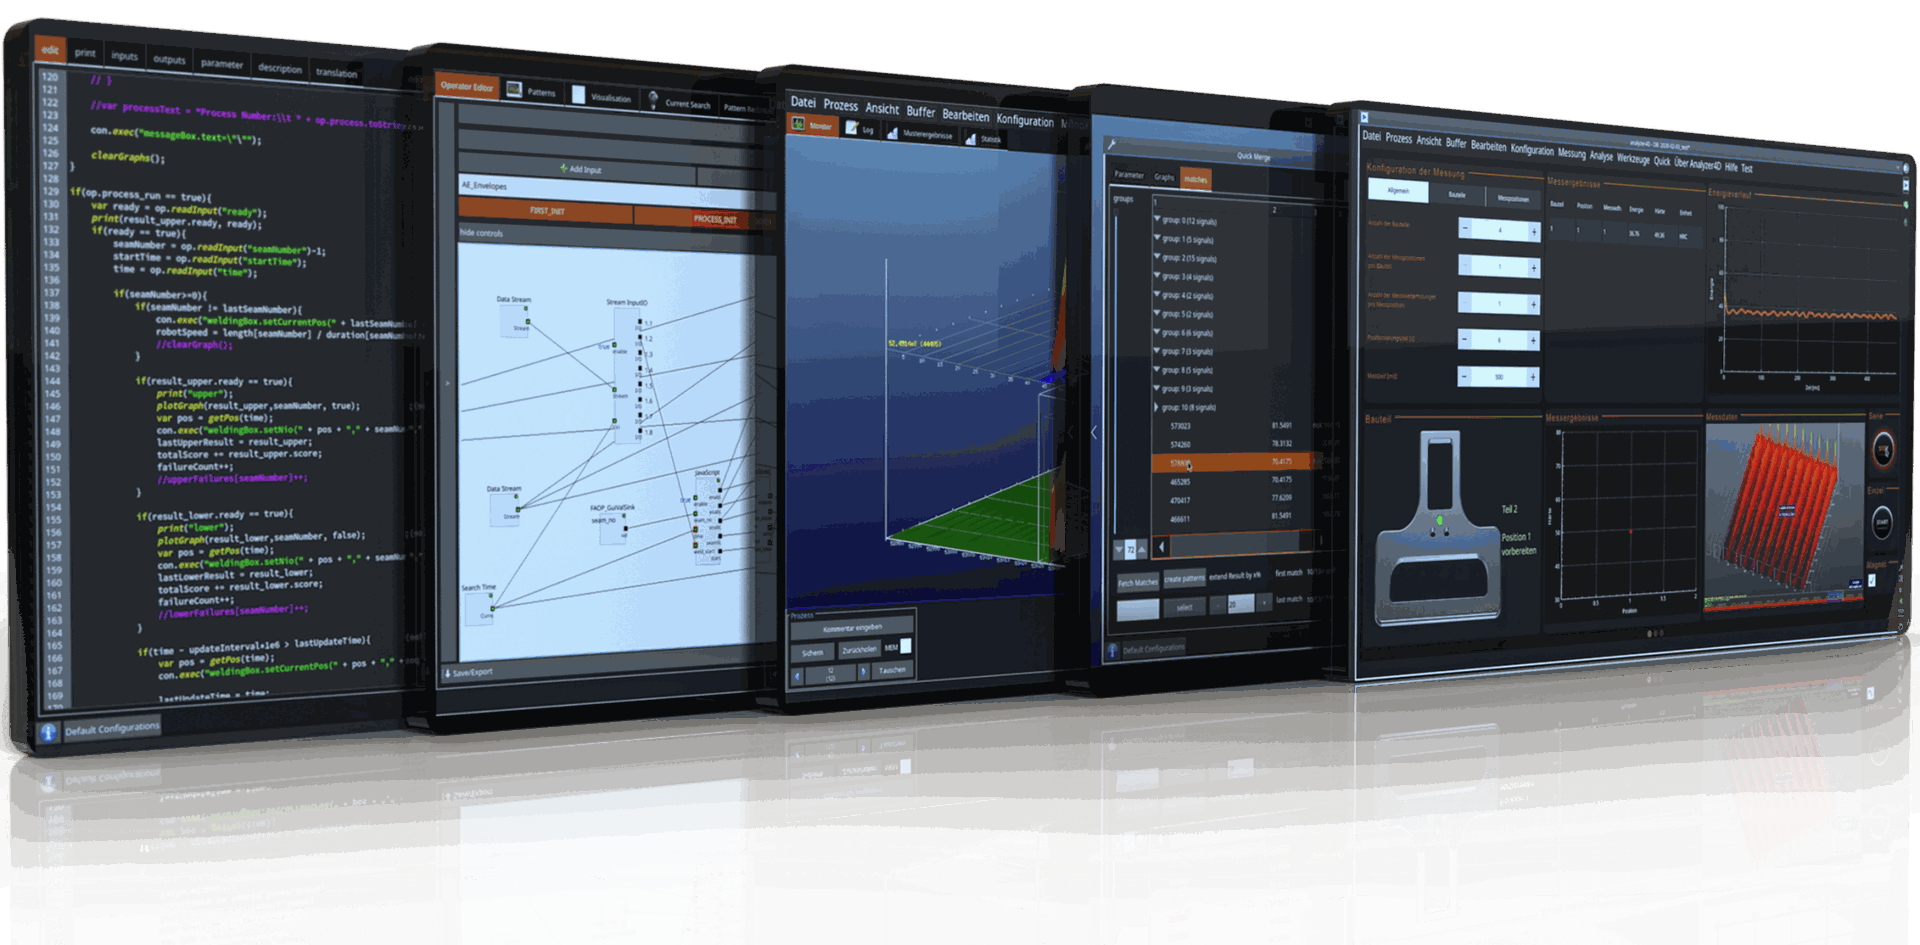
Scripting
Programmable evaluation modules with Python

Maximum adaptivity through Python scripting
- Enables data analysis with Python
- Enables the use of Datascience modules and libraries
- Integration of machine learning algorithms
- Open for the end user
- Allows you to write your own modules
Operator network
Graphical measurement programming
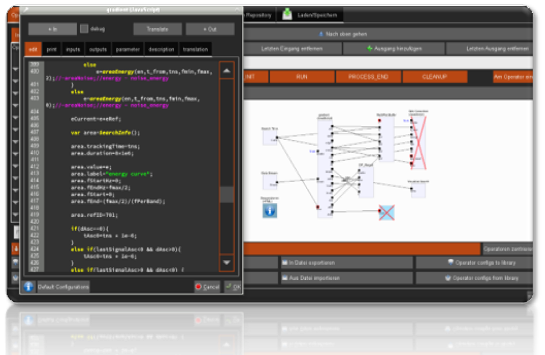
The QASS Operator Model
- Optical scripting of the evaluation modules
- Evaluation modules can be interconnected as required
- Scripting modules enable specially adapted analysis algorithms in Python and Javascript
- Graphical measurement programming
Pattern recognition
Recognition of patterns in the Analyzer4D software
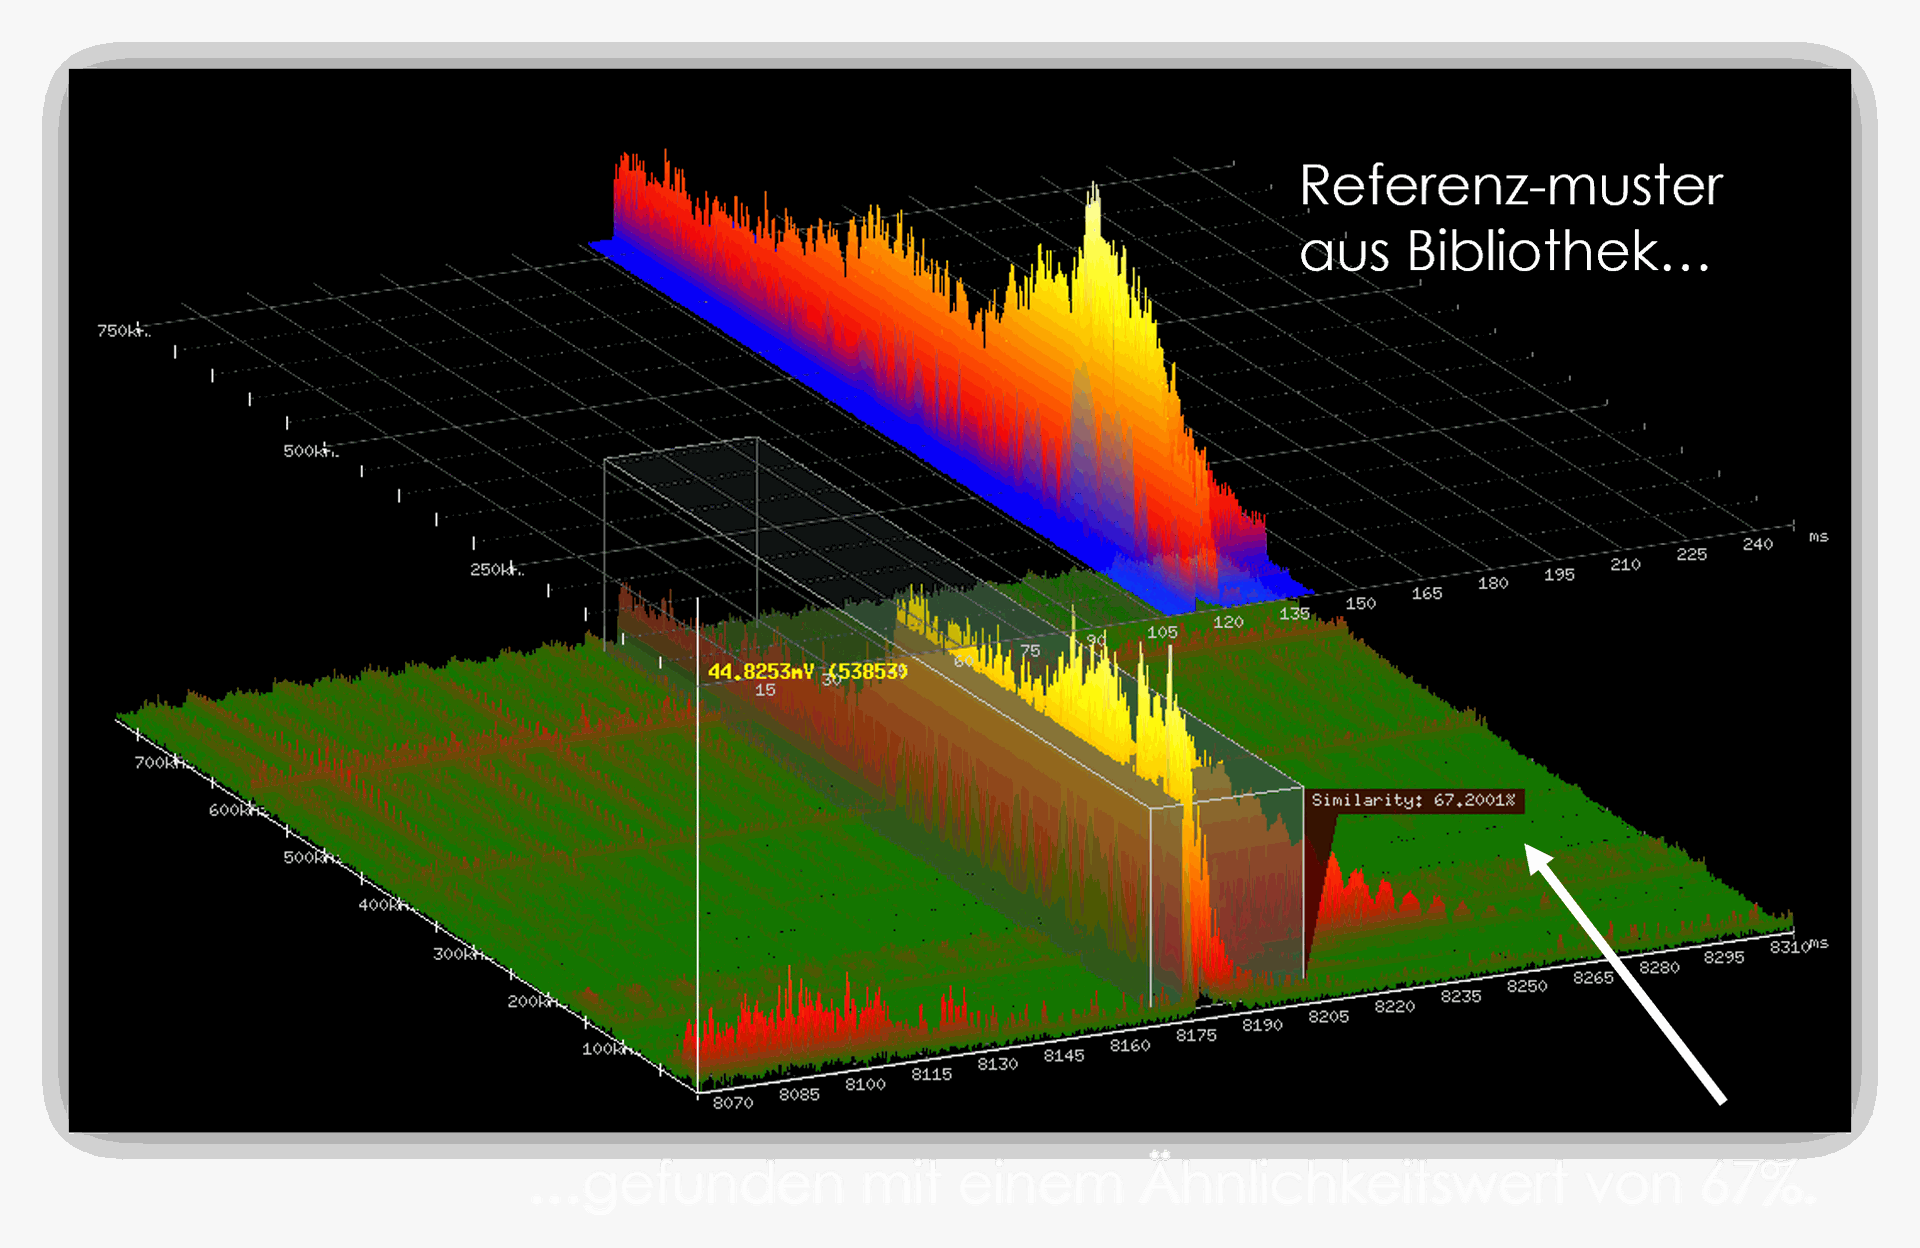
Why pattern recognition?
- Thresholds are often useless for adaptations to processes when process parameters are subject to drifts or intentional adjustments.
- By storing concise patterns, it is possible to distinguish between cracks
- The signal analysis then searches for similar signals (image comparisons)
- More stable and reliable than a threshold approach
Noise suppression
Noise suppression and filtering
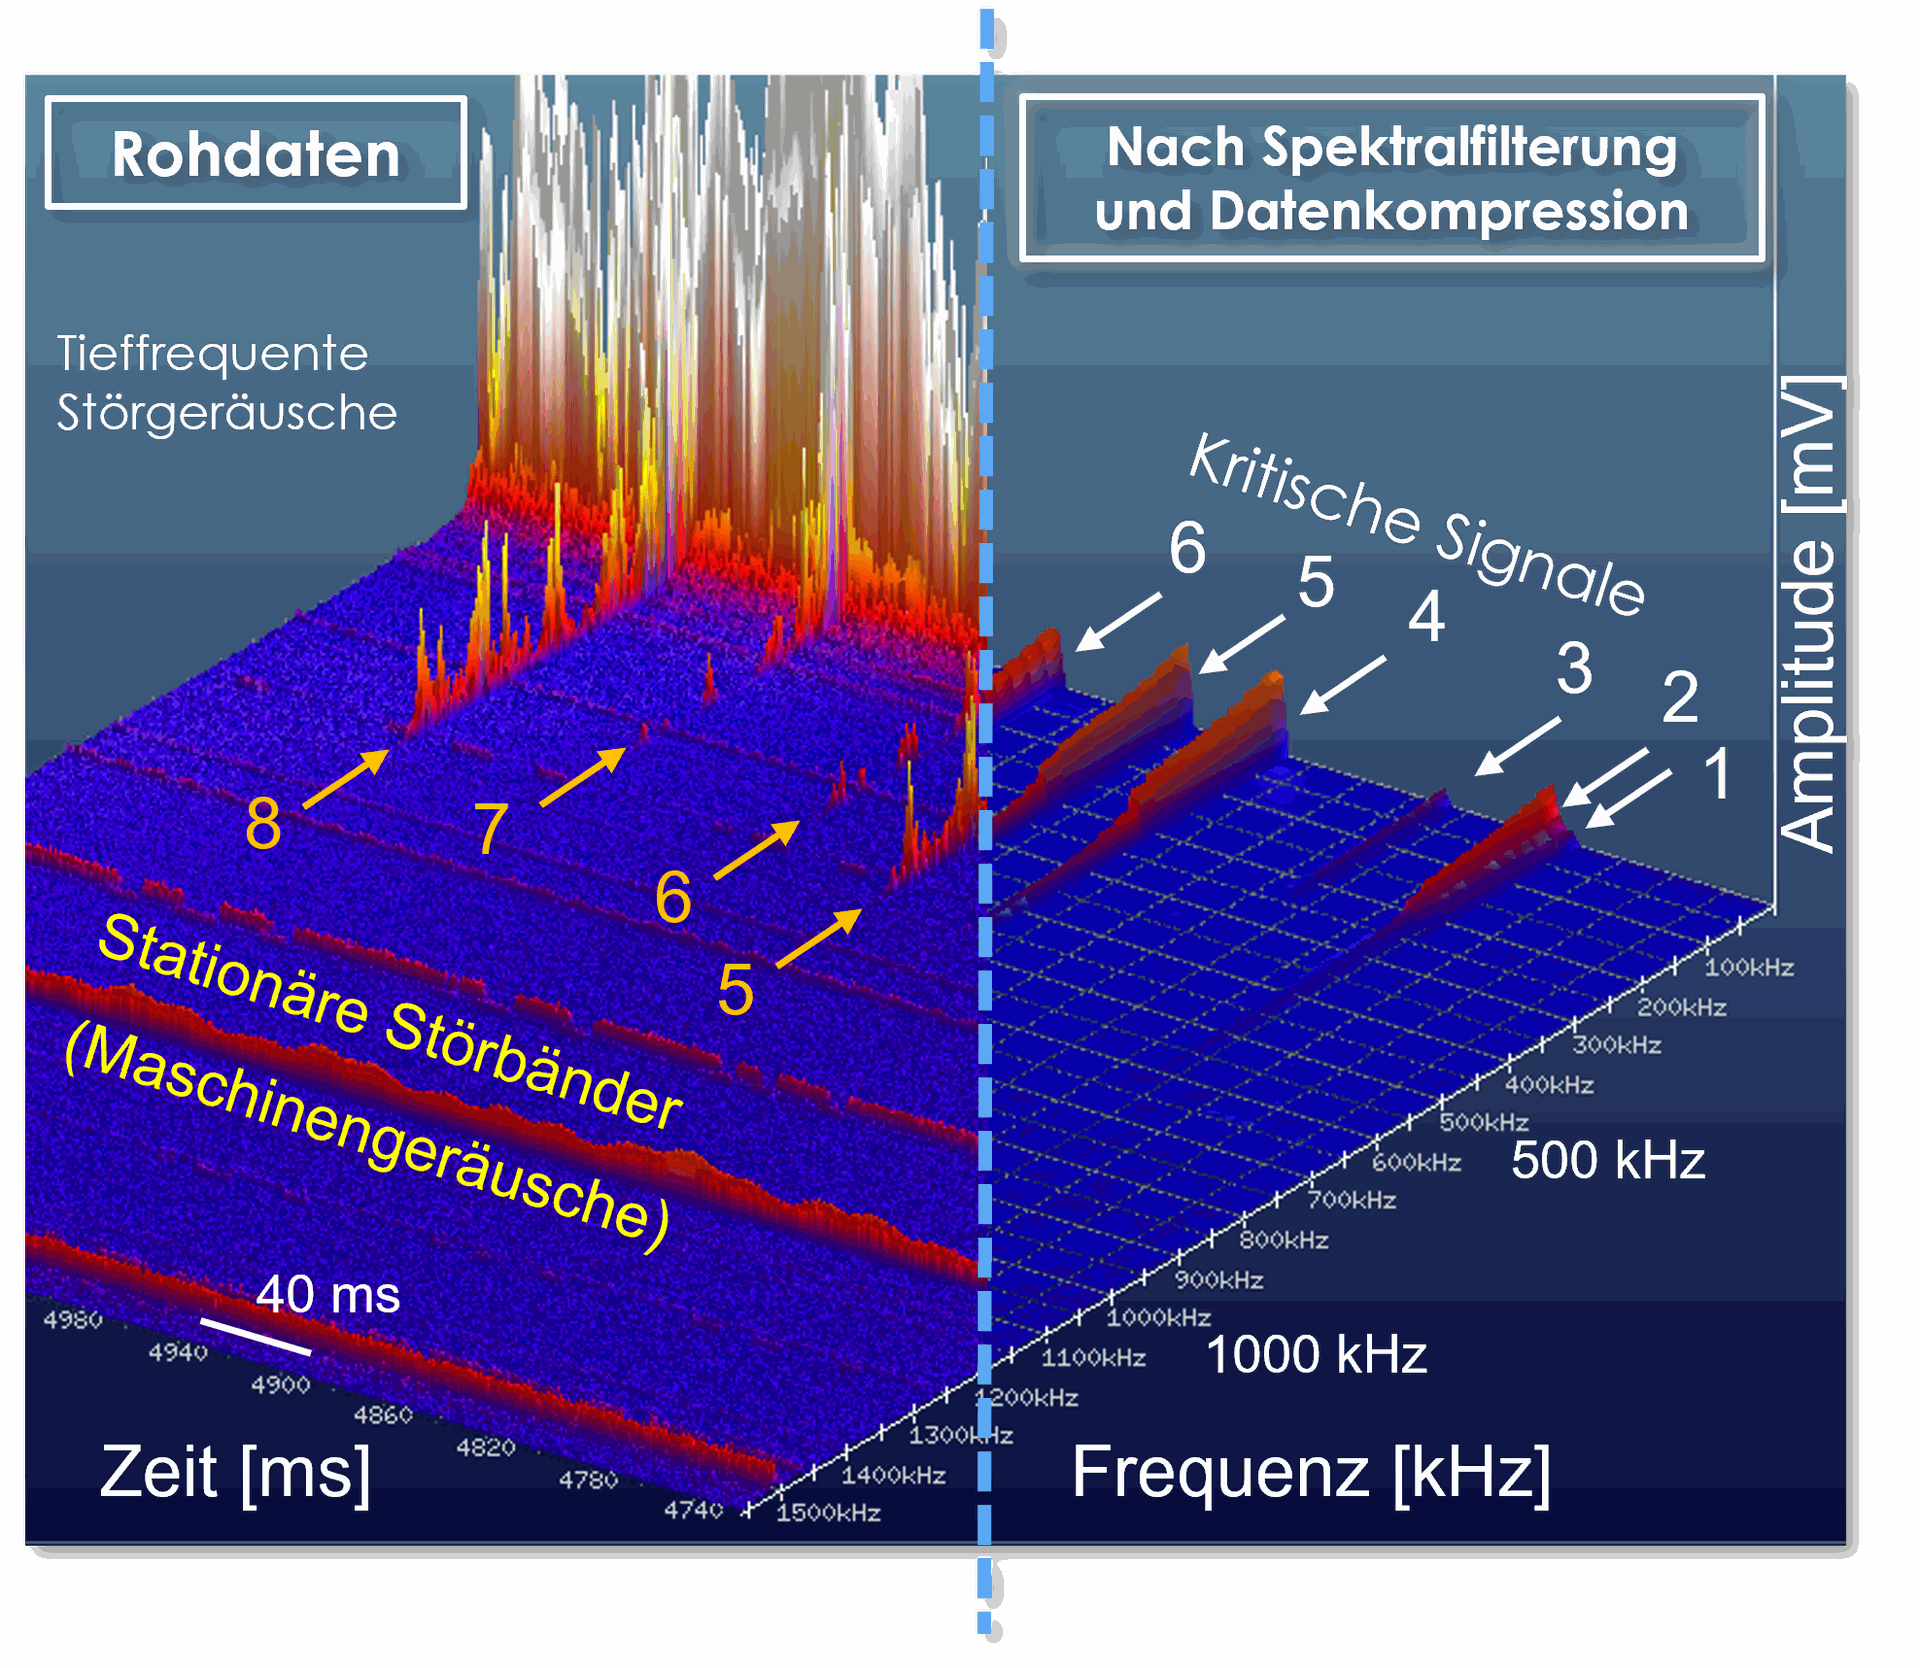
Preprocessing of the measurement data
- Noise suppression by means of spectral filtering
- Compression of the data to the essential content
3D Spectral analysis
3D process landscape (spectrogram)
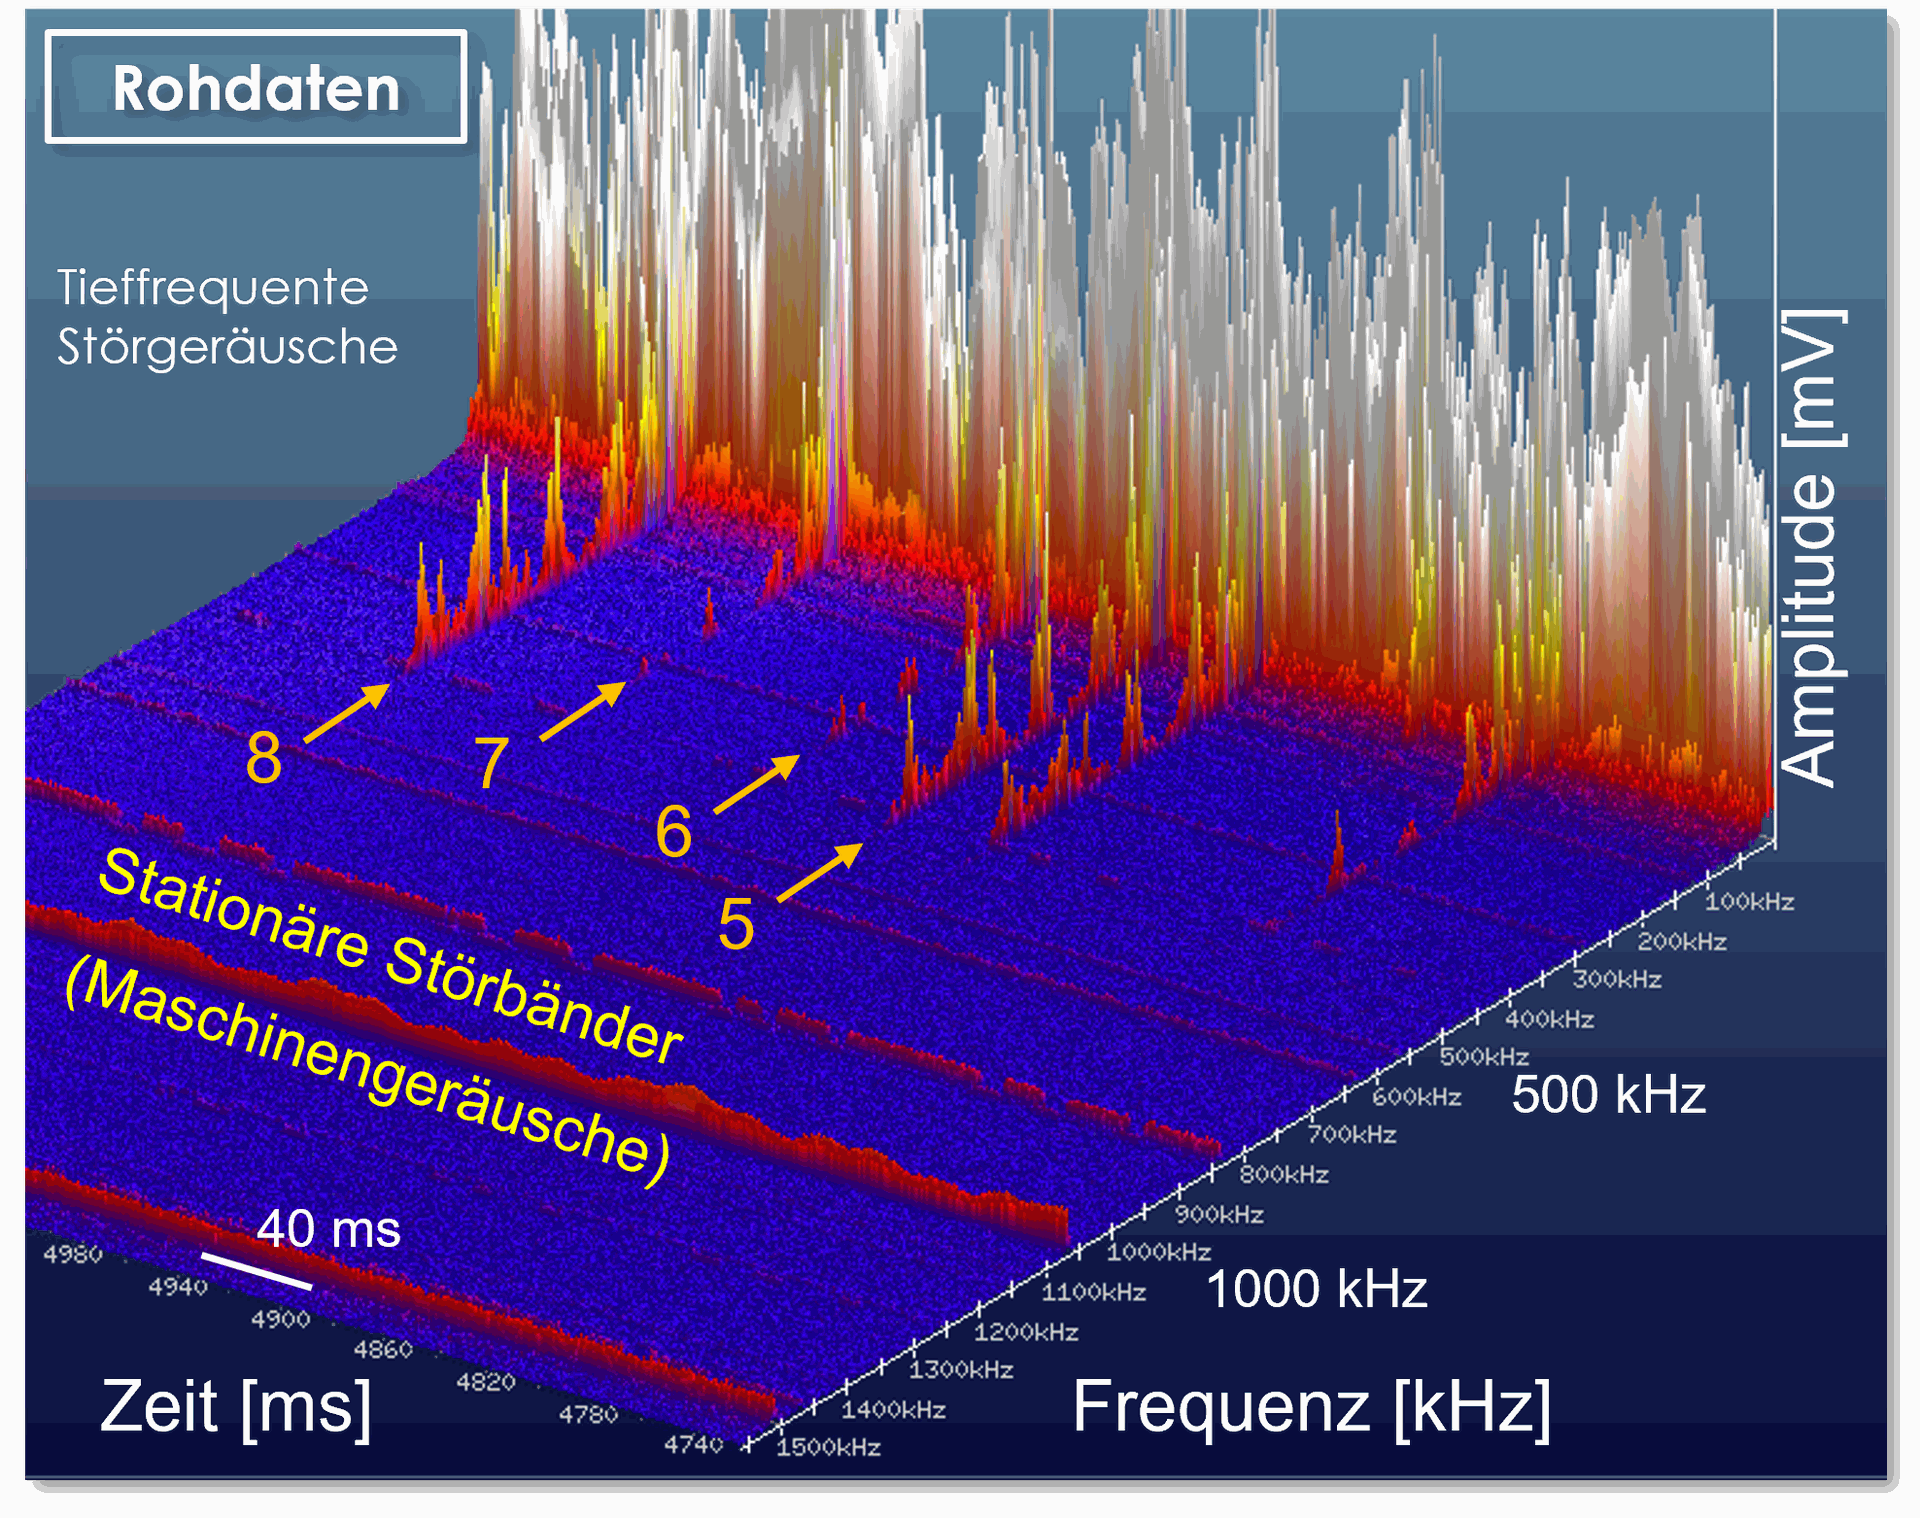
Advantages:
- 3D display of the measurement data in the axes time - frequency - amplitude
- Improved signal detection compared to conventional 2D display (time - amplitude)